Understanding Analyze: Volume Page
Introduction to Analyze's Volume Page
The Volume Page Overview
Let's walk through all the different widgets, graphs, and features of the Volume Page. The Volume Page is made up of the following widgets:
- Volume Summary
- Inbound Volume Total
- Outbound Volume Total
- Volume Breakdown by Tier
- Volume Breakdown by Channel
- Volume Breakdown by Sentiment (inbound)
- Volume Breakdown by Language (inbound)
- Volume Breakdown by Reply Source (outbound)
- Volume by Day
- Volume by Hour
- Top Words
- Top Entities will also display in this widget if you have a custom Enterprise configuration
- Top Protocols & Top Tags
The Volume Summary
The Volume Summary widget displays a variety of summary metrics relating to your inbound and outbound volume for a selected time period. There are additional filtering options available within this widget to display different volume summaries. Let's walk through them now:
Volume Breakdown by Tier
Displays total volume for your selected time period by Tier. This view will automatically default to show the Tier breakdown with Sentiment. Hovering over the sentiment bars will show the piece counts per sentiment within each tier. By clicking the 'SENTIMENT' dropdown, you have the ability to disable the sentiment splits in order to see just the total piece counts per tier.
Volume Breakdown by Channel
Displays total volume for your selected time period by Channel. Additional display options are available by clicking the 'SENTIMENT' dropdown. You can display your Volume by Channel data with no split or with an inbound/outbound split as well. NOTE: If viewing the data with Sentiment splits, it only applies to Inbound pieces.
Volume Breakdown by Sentiment (inbound)
Displays total inbound volume for your selected time period by Sentiment.
Volume Breakdown by Language (inbound)
Displays total inbound volume for your selected time period by detected language. Additional display options are available to view your data splits by sentiment.
Volume Breakdown by Reply Source (outbound)
Displays total outbound volume for your selected time period by who sent replies to pieces. This breakdown is especially helpful if your DGTLsuite subscription includes one or more 3rd party MSPs or an automated chatbot.
Volume by Day
The Volume by Day widget displays both the inbound and outbound volume by day for your selected time period. Hover over a data point on the line graph to see more details on that specific day. Click on any point of the line graph to pull up the day's Drillthrough Panel. The Drillthrough Panel shows a more detailed breakdown of all inbound and outbound messages.
In the day Drillthrough Panel, the following details are displayed:
- If the message was inbound or outbound
- Date
- Message type and Channel
- Message Preview
- Tier
- Sentiment
- Protocol Used
- Tags
You can view all messages from your day Drillthrough Panel directly in DGTL Engage, by clicking the icon in the 'VIEW' column of the panel.
NOTE: If you want to view a Drillthrough Panel for your entire selected time period, instead of just one day at a time, click 'VIEW ALL' in the upper right corner of the Volume by Day Widget.
Volume by Hour
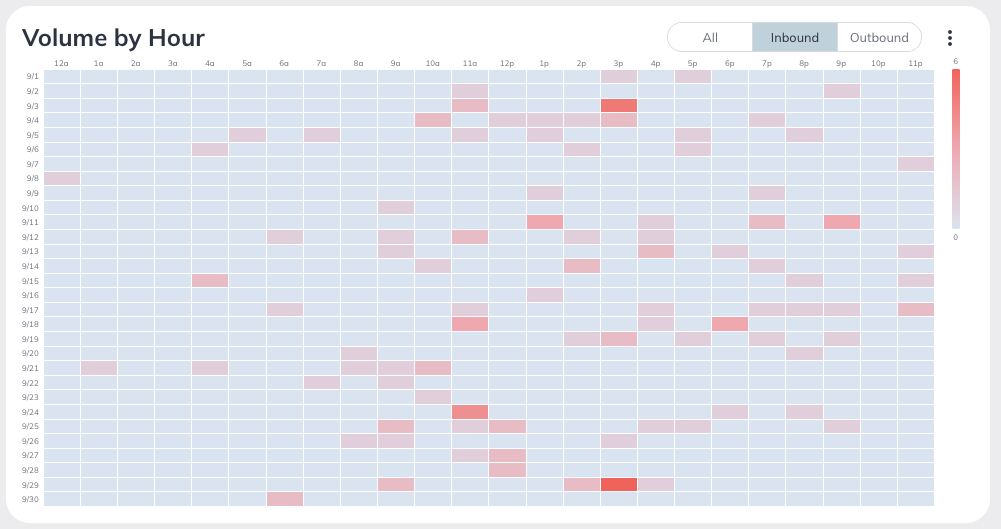
The Volume by Hour widget is displayed as a heatmap. The heatmap provides the total number of inbound and outbound items by hour & day. Higher volume cells are red while lower volume cells are blue. Click on any cell within the heatmap to pull up that hour's Inbound Drillthrough Panel.
You can view all messages from the hour's Drillthrough Panel directly in DGTL Engage, by clicking the icon in the 'VIEW' column of the panel.
Toggle the view of your heatmap using the widget tabs to display total volume, just inbound volume, or just outbound volume.
Exporting Your Heatmap Data
You can easily export the data from your heatmap to your preferred spreadsheet program, such as Microsoft Excel or Google Sheets. Click on the 3 dot menu within the widget to copy the heatmap data to your clipboard. Next, open up the spreadsheet program and paste the data into your spreadsheet.
Top Words and Top Entities
This widget displays the top 20 words and entities along with an interpreted sentiment.
- Top Words: A list of the top 20 words used in all inbound pieces. Emojis, links, and user handles can be included in the Top Words list.
- Top Entities: A list of the top 20 nouns used in all inbound pieces. Adverbs and common prepositions are automatically filtered out.
NOTE: Top Entities will only display if you are a Business-level subscriber or have a custom Enterprise configuration.
See Entity and Word FAQs HERE.
Top Protocols and Top Tags
This widget displays the top 20 protocols and tags along with the associated sentiment and total number of uses of each protocol/tag in the selected time frame. You can toggle between displaying the top Protocols and top Tags by clicking on the widget header. To learn more about Protocols and Tags, check out the article HERE.
Related Articles
Understanding Analyze: Sentiment Page
Introduction to Analyze's Sentiment Page The Sentiment Page Overview The Sentiment Page provides a comprehensive visual representation of the sentiment associated with conversations in Engage. This page empowers you to understand customer perceptions ...Understanding Analyze: Users Page
Introduction to Analyze's Users Page The Users Page Overview The Users Page in DGTL Analyze offers an in-depth look at individual user activity within your team's inbox (DGTL Engage). Here, you can track key metrics such as the number of ...Understanding Analyze: Responses Page
Introduction to Analyze's Responses Page The Responses Page Overview & Key Terms The Responses Page displays more details on responses sent through DGTL Engage. Let's walk through all the different widgets, graphs, and features of the Responses Page: ...Understanding Analyze: Content Page
Introduction to Analyze's Content Page What Does the Content Page Display? Analyze's Content Page displays an overview of Individual Post Performance across your social media channels. Clicking on any of the individual posts will bring up more ...Understanding Analyze: Accounts Page
Introduction to Analyze's Accounts Page The Accounts Page Overview The Accounts Page is a key feature of our analytics platform, providing account-level insights for your authenticated social media channels. The page is divided into two main ...